MapOverlay
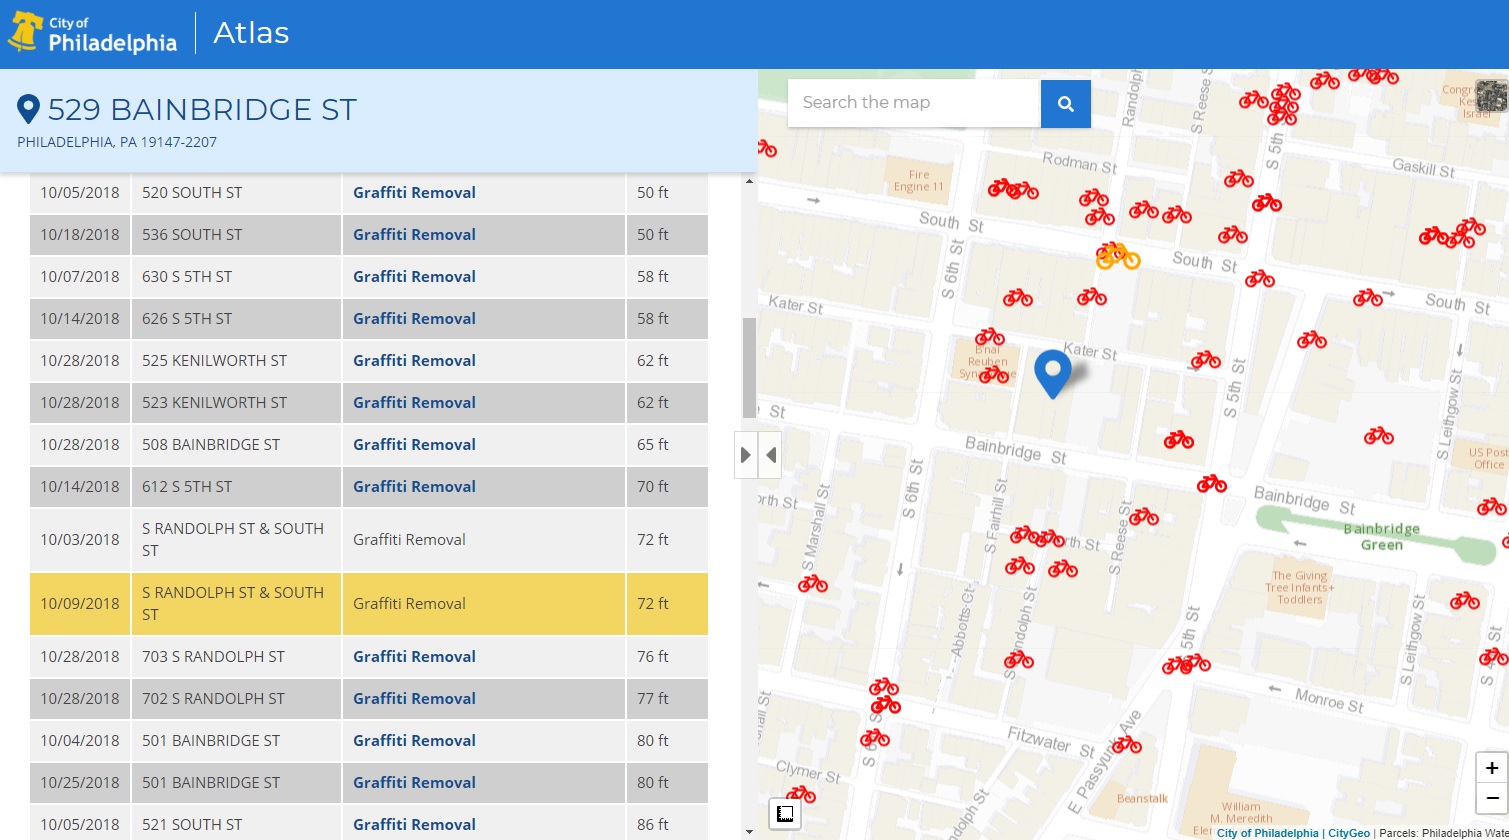
MapOverlay allows for the capability to show points from multiple horizontal tables, each with different marker options specified, including icons from font awesome. Icons will highlight along with their corresponding table row and vice versa.
A horizontal table will include a row for each record of a dataset. The fields must be fields of the records in the state.
options:
| option | description or example |
|---|---|
| marker | |
| style | |
| hoverStyle |
marker:
| option | description or example |
|---|---|
| circle | Uses [circleMarker]https://leafletjs.com/reference-1.3.4.html#circlemarker from leaflet |
| vector | Uses divIcon from leaflet |
style:
| slot | marker | description or example |
|---|---|---|
| fa | vector | Fontawesome icon |
| prefix | prefix for fontawesome from fa | |
| size | circle, vector | Numeric |
| radius | circle | |
| fillColor | circle, vector | |
| color | circle, vector | |
| weight | circle | |
| opacity | circle, vector | |
| fillOpacity | circle |
hoverStyle: Same properties as style for mouse over.
Example:
  mapOverlay: {
    marker: 'vector',
    style: {
      fa: 'bicycle',
      prefix: 'fas',
      size: 2,
      radius: 6,
      fillColor: 'red',
      // fillColor: '#ff3f3f',
      color: '#ff0000',
      weight: 1,
      opacity: 1,
      fillOpacity: 1.0
    },
    hoverStyle: {
      fa: 'bicycle',
      prefix: 'fas',
      size: 3,
      radius: 6,
      fillColor: 'orange',
      color: '#ff0000',
      weight: 1,
      opacity: 1,
      fillOpacity: 1.0
    }
  },