Plot recipe for MDS from MultivariateStats.jl #229
Conversation
|
That looks sweet! Have you considered an interface for multiple dimensions? Either passing dimensions manually, or using subplots or possibly 3d? |
|
@mkborregaard I have considered, but wasn't sure about the implementation. Since this is not a user recipe, can I add a keyword for that? |
|
Sure :-) |
|
(technically this is a user recipe) |
|
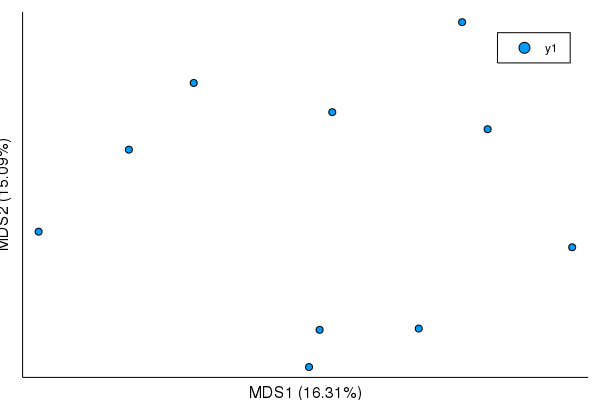
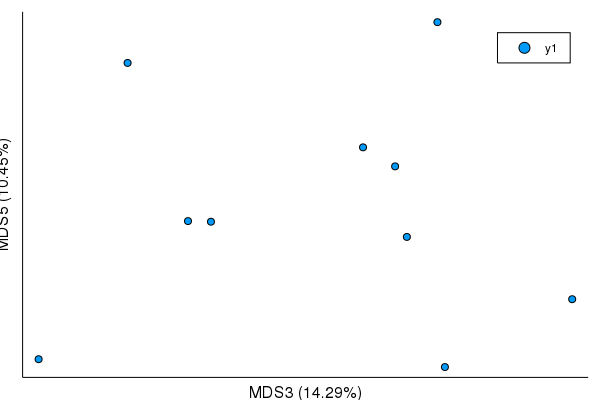
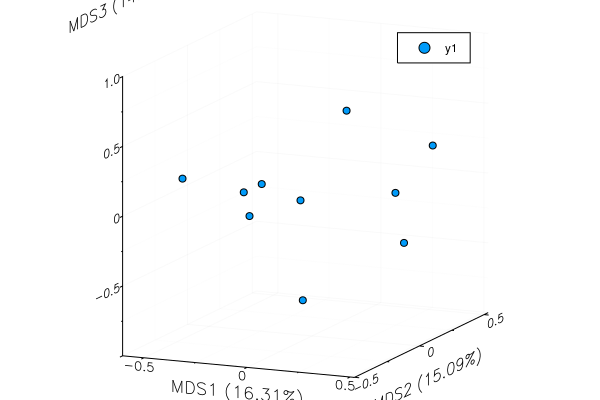
I think I was mis-remembering the deal with keyword arguments... In any case, this now allows a user to specify axes, and do a 3rd axis: using StatsPlots
using Distances
using MultivariateStats
m = rand(100, 10)
dm = pairwise(BrayCurtis(), m)
mds = fit(MDS, dm, distances=true)
plot(mds)
plot(mds, mds_axes=(3,5))
plot(mds, mds_axes=(1,2,3))
|
|
Love it ❤️ |
|
Oh - I merged already, but only now realised - shouldn't |
| @@ -0,0 +1,22 @@ | |||
| @recipe function f(mds::MDS{<:Real}; mds_axes=(1,2)) | |||
There was a problem hiding this comment.
Also, I think you're missing a dep on MultivariateStats for this to work?
There was a problem hiding this comment.
Wait, you do have that, I seem to have a local problem, sorry for the noise
|
Not sure, what does that do? Happy to add it in. |
|
@kescobo I'm getting Also, could the signature be wider to allow for PCAs and other ordinations as well? Is the interface not general enough for this? It would be awesome to have a readme example with this code using MultivariateStats, RDatasets, StatsPlots
iris = dataset("datasets", "iris")
Xtr = convert(Matrix, iris[:, 1:4])'
M = fit(PCA, Xtr; maxoutdim=2)
plot(M, group = iris.Species)or something like that. Compare the code here: https://multivariatestatsjl.readthedocs.io/en/latest/pca.html#data-analysis |
Forces the axes to have the same scale. Given that they are by definition on the same scale it gives a more correct representation of the spread on the axes. |
You have to be on master of MultivariatStats (see the first comment in this thread=). The PR introducing this API hasn't been tagged, so I can't add it to
I haven't looked into it, but I thought about the same thing. I will happily do a separate PR.
Sure - should this be a separate PR since this one is already merged? |
My understanding was that for PCoA at least, the scales are essentially unitless and so scaling is meaningless. Entirely possible I misunderstood that though 😆 |
Sorry 😂
Yay! 💖
I think it has to be yeah.
AFAIK the PCoA transformation maintains distances among points. But if Plots chooses different scales for the x and y axis (based on the range of the data and the shape of the plotting window), the distances will not be correct. |
But PCoA is for non-metric distances right? Maybe I'll ask on Slack... |
This reverts commit 59254e3.
This is dependent on JuliaStats/MultivariateStats.jl#85, though I'm not quite sure how to indicate that in compat until it's tagged.