Task for Constrained changepoint GUI project Following are the commands for R code with output
Q-Download the gfpop package, change the penalty parameter, and make a multi-panel plot(one panel for each penalty parameter value)
A-To run the submitted file locally :
library(devtools)
source_url("https://github.com/raw/RohanDudeja/guiTask/master/easyTask.R")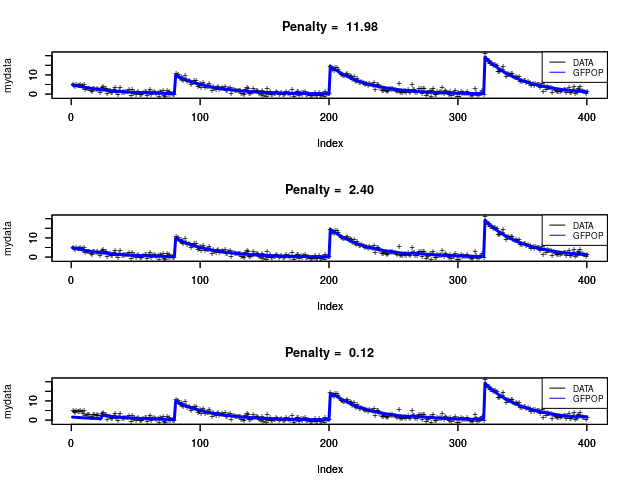
Q-Shiny app with an input that allows you to select the penalty parameter in that data set
A-To run the examples locally, install the shiny package in R, and use the function runGitHub()
if (!require('shiny')) install.packages("shiny")
shiny::runGitHub("guiTask", "RohanDudeja", subdir = "shinyApp")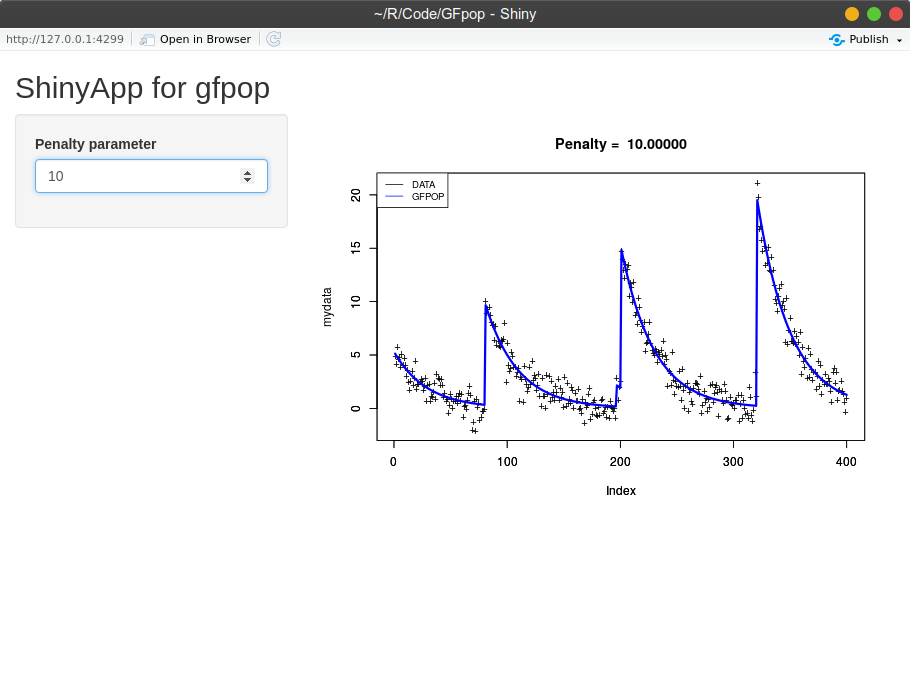
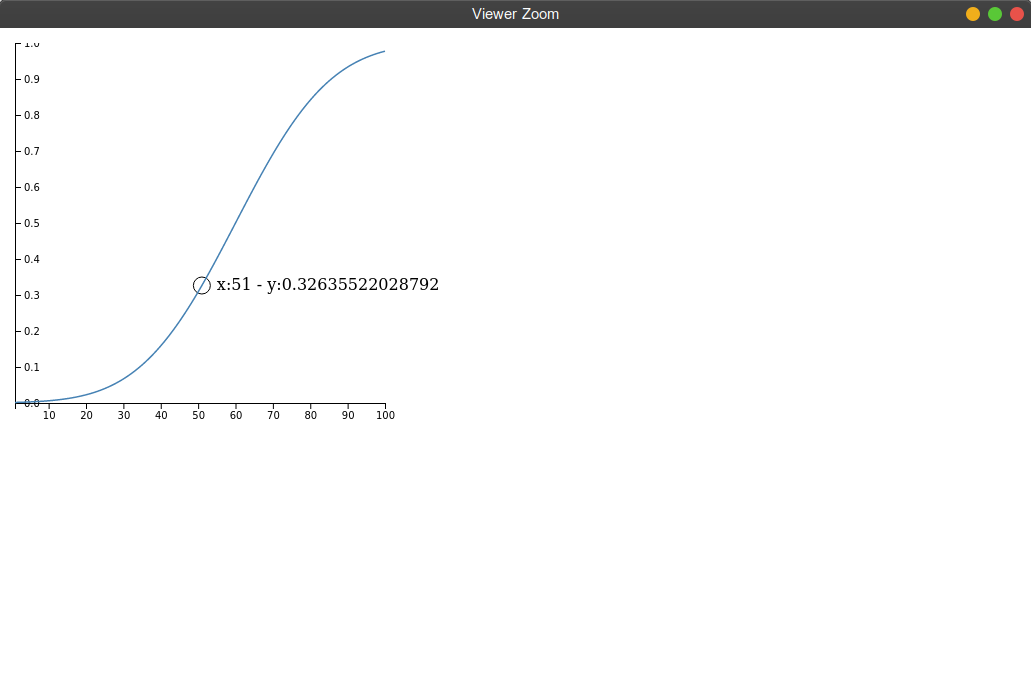
Q-D3.js data visualization in which you can hover over one displayed item
A-
1.Download the js file containing D3 code
2.Get the input data for r2d3 package
3.Output is plotted in continuous form and hovering over data point displays it x and y coordinates
library("devtools")
install.packages("r2d3")
download.file("https://github.com/raw/RohanDudeja/guiTask/master/d3task/d3task.js",destfile = "d3task.js")
source_url("https://github.com/raw/RohanDudeja/guiTask/master/d3task/rdata.R")
r2d3(data = d,script ='d3task.js')