You signed in with another tab or window. Reload to refresh your session.You signed out in another tab or window. Reload to refresh your session.You switched accounts on another tab or window. Reload to refresh your session.Dismiss alert
This file contains hidden or bidirectional Unicode text that may be interpreted or compiled differently than what appears below. To review, open the file in an editor that reveals hidden Unicode characters.
Learn more about bidirectional Unicode characters
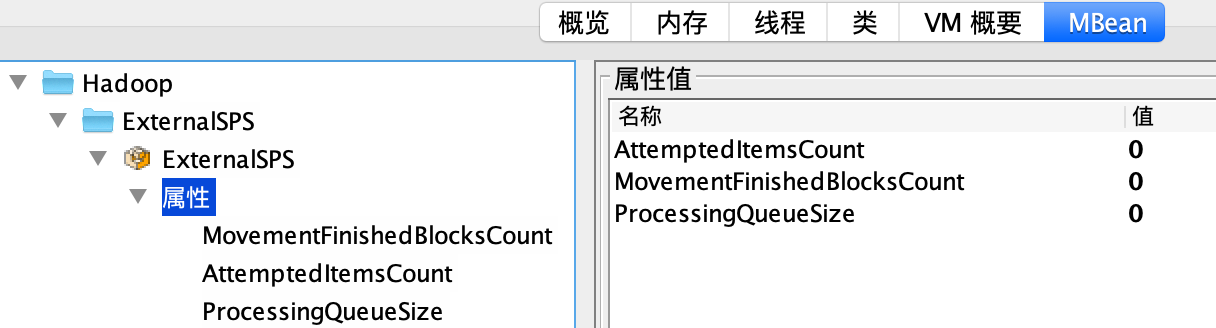
Currently, external SPS has no monitoring metrics. We do not know how many blocks are waiting to be processed, how many blocks are waiting to be retried, and how many blocks have been migrated.
We can expose these metrics in JMX for easy collection and display by monitoring systems.
For example, in our cluster, we exposed these metrics to JMX, collected by JMX-Exporter and combined with Prometheus, and finally display by Grafana.
hadoop-hdfs-project/hadoop-hdfs generated 1 new + 0 unchanged - 0 fixed = 1 total (was 0)
+1 💚
shadedclient
26m 46s
patch has no errors when building and testing our client artifacts.
_ Other Tests _
+1 💚
unit
376m 52s
hadoop-hdfs in the patch passed.
+1 💚
asflicense
0m 47s
The patch does not generate ASF License warnings.
492m 46s
Reason
Tests
SpotBugs
module:hadoop-hdfs-project/hadoop-hdfs
Primitive value is boxed and then immediately unboxed in org.apache.hadoop.hdfs.server.sps.metrics.ExternalSPSBeanMetrics.updateMovementFinishedBlocksCount() At ExternalSPSBeanMetrics.java:then immediately unboxed in org.apache.hadoop.hdfs.server.sps.metrics.ExternalSPSBeanMetrics.updateMovementFinishedBlocksCount() At ExternalSPSBeanMetrics.java:[line 87]
Hi @umamaheswararao@ayushtkn@tasanuma@ferhui
Currently, external SPS has no metrics. We do not know the migration progress of the corresponding block, adding metrics are helpful. Could you please take a look? Thank you very much.
@tomscut@ferhui@ayushtkn
testExternalSPSMetrics is a duplicated function name which is already defined in TestExternalStoragePolicySatisfier.java
this patch is breaking trunk build, please fix it, thanks.
@tomscut@ferhui@ayushtkn testExternalSPSMetrics is a duplicated function name which is already defined in TestExternalStoragePolicySatisfier.java this patch is breaking trunk build, please fix it, thanks.
Thanks @yuanboliu for pointing this out. I will fix this.
Add this suggestion to a batch that can be applied as a single commit.This suggestion is invalid because no changes were made to the code.Suggestions cannot be applied while the pull request is closed.Suggestions cannot be applied while viewing a subset of changes.Only one suggestion per line can be applied in a batch.Add this suggestion to a batch that can be applied as a single commit.Applying suggestions on deleted lines is not supported.You must change the existing code in this line in order to create a valid suggestion.Outdated suggestions cannot be applied.This suggestion has been applied or marked resolved.Suggestions cannot be applied from pending reviews.Suggestions cannot be applied on multi-line comments.Suggestions cannot be applied while the pull request is queued to merge.Suggestion cannot be applied right now. Please check back later.
JIRA: HDFS-16488.
Currently, external SPS has no monitoring metrics. We do not know how many blocks are waiting to be processed, how many blocks are waiting to be retried, and how many blocks have been migrated.
We can expose these metrics in JMX for easy collection and display by monitoring systems.
For example, in our cluster, we exposed these metrics to JMX, collected by JMX-Exporter and combined with Prometheus, and finally display by Grafana.