Cypress breaks Chrome dev tools debugging #19436
Description
Current behavior
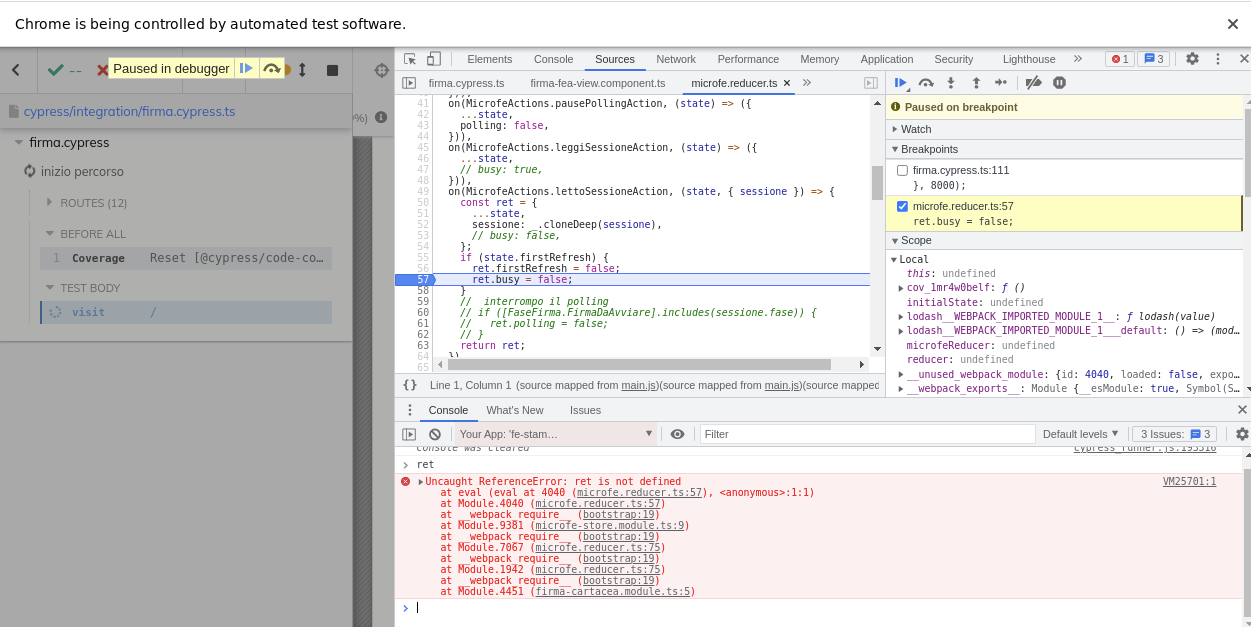
When running my app within Cypress, Chrome dev tools debugger shows inconsistent behaviour on the app code.
As you can see from the screenshot, some code lines are greyed out making it impossibile to stop on them, and you cannot even inspect variables (ret in this example).
It seems the breakpoint is not consistent with where the code has really stopped.
Everything works perfectly when Chrome runs outside of Cypress.
Desired behavior
The Chrome debugger should work the same way it does outside Cypress.
Test code to reproduce
It happens on any project run under Cypress.
Cypress Version
9.1.1
Other
No response