Closed
Description
What version of Go are you using (go version)?
go version go1.11.4 darwin/amd64
and
go version go1.11.4 linux/amd64
Does this issue reproduce with the latest release?
yes
What operating system and processor architecture are you using (go env)?
go env Output - linux
GOARCH="amd64"
GOBIN=""
GOCACHE="/root/.cache/go-build"
GOEXE=""
GOFLAGS=""
GOHOSTARCH="amd64"
GOHOSTOS="linux"
GOOS="linux"
GOPATH="/go"
GOPROXY=""
GORACE=""
GOROOT="/usr/local/go"
GOTMPDIR=""
GOTOOLDIR="/usr/local/go/pkg/tool/linux_amd64"
GCCGO="gccgo"
CC="gcc"
CXX="g++"
CGO_ENABLED="1"
GOMOD=""
CGO_CFLAGS="-g -O2"
CGO_CPPFLAGS=""
CGO_CXXFLAGS="-g -O2"
CGO_FFLAGS="-g -O2"
CGO_LDFLAGS="-g -O2"
PKG_CONFIG="pkg-config"
GOGCCFLAGS="-fPIC -m64 -pthread -fmessage-length=0 -fdebug-prefix-map=/tmp/go-build071389412=/tmp/go-build -gno-record-gcc-switches"
go env Output - MacOS
GOARCH="amd64"
GOBIN=""
GOCACHE="/Users/danielz/Library/Caches/go-build"
GOEXE=""
GOFLAGS=""
GOHOSTARCH="amd64"
GOHOSTOS="darwin"
GOOS="darwin"
GOPATH="/Users/danielz/golang"
GOPROXY=""
GORACE=""
GOROOT="/usr/local/opt/go/libexec"
GOTMPDIR=""
GOTOOLDIR="/usr/local/opt/go/libexec/pkg/tool/darwin_amd64"
GCCGO="gccgo"
CC="clang"
CXX="clang++"
CGO_ENABLED="1"
GOMOD=""
CGO_CFLAGS="-g -O2"
CGO_CPPFLAGS=""
CGO_CXXFLAGS="-g -O2"
CGO_FFLAGS="-g -O2"
CGO_LDFLAGS="-g -O2"
PKG_CONFIG="pkg-config"
GOGCCFLAGS="-fPIC -m64 -pthread -fno-caret-diagnostics -Qunused-arguments -fmessage-length=0 -fdebug-prefix-map=/var/folders/16/774hkyp521l6r1__tw4fllph4rwwk2/T/go-build437434626=/tmp/go-build -gno-record-gcc-switches -fno-common"
What did you do?
https://play.golang.org/p/K5ZvGZ4hmdH
What did you expect to see?
As expected, on linux, I see the delta in RSS roughly matching the memory returned to the OS by scavenger (calling debug.FreeOSMemory())
Starting 50000 goroutines
gc 1 @0.018s 64%: 46+20+0.73 ms clock, 278+10/41/0+4.4 ms cpu, 4->22->19 MB, 23 MB goal, 6 P
gc 2 @0.089s 59%: 0.16+31+0.65 ms clock, 0.97+65/32/0+3.9 ms cpu, 21->21->20 MB, 39 MB goal, 6 P
Waiting for them to finish...
Freeing OS memory...
gc 3 @0.164s 42%: 0.77+9.4+0.27 ms clock, 4.6+0/9.1/22+1.6 ms cpu, 25->25->19 MB, 41 MB goal, 6 P (forced)
scvg-1: 104 MB released
scvg-1: inuse: 20, idle: 104, sys: 125, released: 104, consumed: 20 (MB)
RSS before: 131932, after: 28404, delta: 103528
Starting 50000 goroutines
Waiting for them to finish...
Freeing OS memory...
gc 4 @3.302s 2%: 1.6+8.3+0.28 ms clock, 10+0/8.3/18+1.7 ms cpu, 26->26->19 MB, 38 MB goal, 6 P (forced)
scvg-1: 104 MB released
scvg-1: inuse: 20, idle: 104, sys: 125, released: 104, consumed: 20 (MB)
RSS before: 133836, after: 28768, delta: 105068
Starting 50000 goroutines
Waiting for them to finish...
Freeing OS memory...
gc 5 @6.416s 1%: 1.3+13+0.27 ms clock, 8.2+0/12/12+1.6 ms cpu, 26->26->19 MB, 38 MB goal, 6 P (forced)
scvg-1: 102 MB released
scvg-1: inuse: 20, idle: 104, sys: 125, released: 104, consumed: 20 (MB)
RSS before: 133080, after: 28140, delta: 104940
Starting 50000 goroutines
Waiting for them to finish...
Freeing OS memory...
gc 6 @9.585s 0%: 1.4+12+0.23 ms clock, 8.8+0/9.5/17+1.3 ms cpu, 26->26->19 MB, 38 MB goal, 6 P (forced)
scvg-1: 104 MB released
scvg-1: inuse: 20, idle: 104, sys: 125, released: 104, consumed: 20 (MB)
RSS before: 133472, after: 28372, delta: 105100
What did you see instead?
In contrast, on OSX I see the scavenger reporting memory being returned, but this is not reflected in RSS (and other places like ActivityMonitor and Instruments)
Starting 50000 goroutines
gc 1 @0.013s 84%: 73+8.4+0.15 ms clock, 881+65/22/0+1.8 ms cpu, 4->22->19 MB, 23 MB goal, 12 P
gc 2 @0.097s 81%: 0.10+8.6+0.11 ms clock, 1.2+52/22/0+1.3 ms cpu, 21->21->20 MB, 39 MB goal, 12 P
Waiting for them to finish...
Freeing OS memory...
gc 3 @0.159s 46%: 1.4+38+0.11 ms clock, 16+1.8/53/93+1.3 ms cpu, 27->28->19 MB, 41 MB goal, 12 P
gc 4 @0.204s 44%: 0.010+5.7+0.070 ms clock, 0.13+0/9.8/18+0.84 ms cpu, 19->19->19 MB, 39 MB goal, 12 P (forced)
scvg-1: 102 MB released
scvg-1: inuse: 20, idle: 102, sys: 122, released: 102, consumed: 20 (MB)
RSS before: 137264, after: 137404, delta: -140
Starting 50000 goroutines
Waiting for them to finish...
Freeing OS memory...
gc 5 @3.333s 3%: 3.0+40+0.094 ms clock, 36+0/46/28+1.1 ms cpu, 27->27->19 MB, 38 MB goal, 12 P (forced)
scvg-1: 101 MB released
scvg-1: inuse: 21, idle: 101, sys: 123, released: 101, consumed: 21 (MB)
RSS before: 137808, after: 137824, delta: -16
Starting 50000 goroutines
Waiting for them to finish...
Freeing OS memory...
gc 6 @6.502s 1%: 3.0+41+0.17 ms clock, 36+0/43/34+2.1 ms cpu, 27->27->19 MB, 39 MB goal, 12 P (forced)
scvg-1: 100 MB released
scvg-1: inuse: 22, idle: 100, sys: 122, released: 100, consumed: 22 (MB)
RSS before: 137844, after: 137844, delta: 0
Starting 50000 goroutines
Waiting for them to finish...
Freeing OS memory...
gc 7 @9.672s 1%: 3.1+41+0.094 ms clock, 37+0/48/23+1.1 ms cpu, 27->27->19 MB, 39 MB goal, 12 P (forced)
scvg-1: 100 MB released
scvg-1: inuse: 22, idle: 100, sys: 122, released: 100, consumed: 22 (MB)
RSS before: 137852, after: 137852, delta: 0
Starting 50000 goroutines
Waiting for them to finish...
Freeing OS memory...
gc 8 @12.861s 0%: 3.5+43+0.068 ms clock, 42+0/45/37+0.81 ms cpu, 27->27->19 MB, 39 MB goal, 12 P (forced)
scvg-1: 99 MB released
scvg-1: inuse: 22, idle: 99, sys: 121, released: 99, consumed: 22 (MB)
RSS before: 137856, after: 137860, delta: -4
Is this expected? Am I missing anything?
Metadata
Metadata
Assignees
Type
Projects
Relationships
Development
No branches or pull requests
Activity
DanielZlotin commentedon Jan 21, 2019
Furthermore, using gomobile
gomobile version +dc07713 Mon Jan 7 16:22:57 2019 +0000 (android,ios); androidSDK=/opt/android_sdk/platforms/android-28Running similar code on iOS (replacing
pscalls by looking at the memory instrumentation provided by Xcode) I see the same pattern as in OSX. Scavenger report for example returning ~180MB to the OS but instruments show this is not the case. This basically means we have a memory leak on iOS / OSX apps.Confirmed on android this is not the case, ie, works the same as on linux.
bradfitz commentedon Jan 22, 2019
Can you try Go 1.12beta2? https://golang.org/dl/#go1.12beta2
DanielZlotin commentedon Jan 22, 2019
Reproduced with Go 1.12beta2 on OSX. same thing..
randall77 commentedon Jan 23, 2019
I'm not sure this demonstrates an actual bug.
We use
madvise(MADV_FREE)on Darwin. That tells the OS that it can take back memory pages if it wants to, but it doesn't have to. The OS will only take the pages back if it needs to give those pages to other processes. So if you have no other memory-hungry load on your system, I wouldn't expect the RSS to go down.It's kind of an unfortunate state. It would be really nice if Darwin reported "committed RSS" or some such stricter meaning of RSS. Without that, we're left guessing if Go is really keeping those pages to itself or not.
Loading up the system with other memory-hungry programs might shed some light on whether we're actually releasing memory correctly or not. That's tricky to do reliably, but might be the only way to make progress here.
See #14521.
randall77 commentedon Jan 23, 2019
I was able to get the OS to take back the memory. Modify your program to add this loop at the end of the existing loop (so we just give back the memory and sit idle):
Then run the following program with argument 10 (to use ~10GB of DRAM):
(My machine has 32GB DRAM, YMMV.)
The program prints its original memory size until I run the memory hog program, then transitions to a much lower memory usage:
DanielZlotin commentedon Jan 23, 2019
@randall77 Thanks, I'll try your suggestion, but in the meanwhile I'll give some more context.
This bug(?) reproduces on iOS on a very memory constrained process (15MB max) which gets killed by the OS with OOM error, so I'm not sure your theory holds there.
I tried playing around with runtime/mem_darwin and printing
sysUnusedwhile checkingvmmapon the PID of the running program, comparing the output before and after allocating and releasing a bunch of G, and I noticedmadvicegetting called with chunks of around 64MB (which matches scavenger reports) butvmmapdiffs shows these chunks are still there inVM_ALLOCATEregions.Just some hunch, I'm still quite confused with what goes on here...
DanielZlotin commentedon Jan 23, 2019
Confirmed your memhog program makes the OS (on darwin) take back the memory. On iOS however (arm64) I'm getting oom.. Any suggestions of where to go from here?
DanielZlotin commentedon Jan 23, 2019
Thinking about replacing
madvisecalls withmunmap, if possible.. (given, much more expensive operation but will allow me to be sure memory was freed), that would probably require a large rewrite and I don't have experience with this so I'm not sure it's feasible.DanielZlotin commentedon Jan 23, 2019
reproduced memory hog in iOS/arm46, had to find the sweet spot of allocating a large enough amount of memory to trigger OS to take back these pages without causing OOM. Even then, not all memory that is released by scavenger is returned, it seems the OS takes some of it, and the amount is not stable across runs..
Any other ideas will be appreciated
ianlancetaylor commentedon Jan 23, 2019
CC @aclements @mknyszek
DanielZlotin commentedon Jan 23, 2019
OK I think I found a way to make OSX and iOS behave as expected:
Changing the flag passed to
madvisefromMADV_FREEtoMADV_FREE_REUSABLE(from 0x5 to 0x7) in mem_darwinrunning this C code on these platforms and instrumenting it will clearly show the difference in memory returned to OS, no other memory pressure is needed:
mknyszek commentedon Jan 23, 2019
I agree with @randall77, AFAICT this is working as intended.
On Linux for go1.11.4 and below we always use
MADV_DONTNEEDwhich causes an immediate drop in RSS, which is why this seems to do what you expect on Linux. However,MADV_DONTNEEDis not very performant because it kicks out those pages immediately too, so page faults to get those pages back are expensive. For go1.12 we useMADV_FREEon Linux 4.5+ as well, so this behavior is going to become more common. There's a debug flag, however, to go back toMADV_DONTNEED(#28466).Replacing
madvisewithmunmapdirectly would be complicated. The runtime assumes that pages that are mapped into the virtual address space are never unmapped, so it would be a significant change to start unmapping pages. Also, I suspect (but am not positive) that mapping and unmapping pages like that will incur a greater performance cost.With that said, I haven't heard of
MADV_FREE_REUSABLE, so thank you for finding it! Switching over to that would be only a small change, but I'd like to gather more details about it's precise behavior and I'm having trouble finding documentation. The darwin source has some hints but it's still pretty vague: https://github.com/apple/darwin-xnu/blob/master/bsd/sys/mman.h#L192. I'll dig into this a little more.randall77 commentedon Jan 23, 2019
MADV_FREE_REUSABLEsounds like exactly what we need.It doesn't appear in the
madviseman page, which makes me a bit nervous. Usually that's where I go to find out whether all of our supported Darwin versions understand a feature.Is there some way we can verify that this is expected and supported behavior? All I can find is one line in
/usr/include/sys/mman.h:mknyszek commentedon Jan 23, 2019
I found (through StackOverflow [1]) an old version of libmalloc which gives some indication: https://opensource.apple.com/source/libmalloc/libmalloc-53.1.1/src/magazine_malloc.c.auto.html
It appears that you need to first call
madvise(MADV_FREE_REUSABLE)followed bymadvise(MADV_FREE_REUSE)when you need to use it again. It doesn't say so explicitly, but this is my hunch just based on the fact that it says the user needs to signal the OS about reuse. The other unfortunate thing about the comment on that page is that on iOS thatMADV_FREE_REUSABLEjust maps toMADV_FREE, andMADV_FREE_REUSE(I think) is a no-op. :( I tried looking in newer libmalloc code for more info but haven't found anything yet.The fact that it's not in the manpage makes me nervous too, but apparently Chrome is using it (https://github.com/chromium/chromium/blob/master/base/memory/discardable_shared_memory.cc#L377). I also found this through StackOverflow [1].
[1]: https://stackoverflow.com/questions/7718964/how-can-i-force-macos-to-release-madv-freed-pages
mknyszek commentedon Jan 23, 2019
Well, looks like Chromium has more information on this, which confirms my suspicions: https://github.com/chromium/chromium/blob/master/base/memory/discardable_shared_memory.cc#L254
The comment there then links to https://bugs.chromium.org/p/chromium/issues/detail?id=823915. Following the trail of Chromium bugs finally leads me to https://bugs.chromium.org/p/chromium/issues/detail?id=708797#c25, where it seems the suggestion was made by someone who knows about Darwin kernel internals.
It still would be nice to get official information about these flags, but I don't know where to look at this point.
If we're to add this, the plan would be to update
sysUnusedon Darwin to useMADV_FREE_REUSABLEandsysUsedto callmadvisewithMADV_FREE_REUSE. I can make this change now, unless there are any objections.5 remaining items
[-]OSX Memory issues with goroutines, different behavior on linux[/-][+]runtime: scavenging doesn't reduce reported RSS on macOS and iOS, may lead to OOMs[/+][-]runtime: scavenging doesn't reduce reported RSS on macOS and iOS, may lead to OOMs[/-][+]runtime: scavenging doesn't reduce reported RSS on darwin, may lead to OOMs on iOS[/+]DanielZlotin commentedon Jan 27, 2019
Thank you all for the thorough explanation and prompt responses.
Can confirm the patch mitigates the issue on both macOS and iOS.
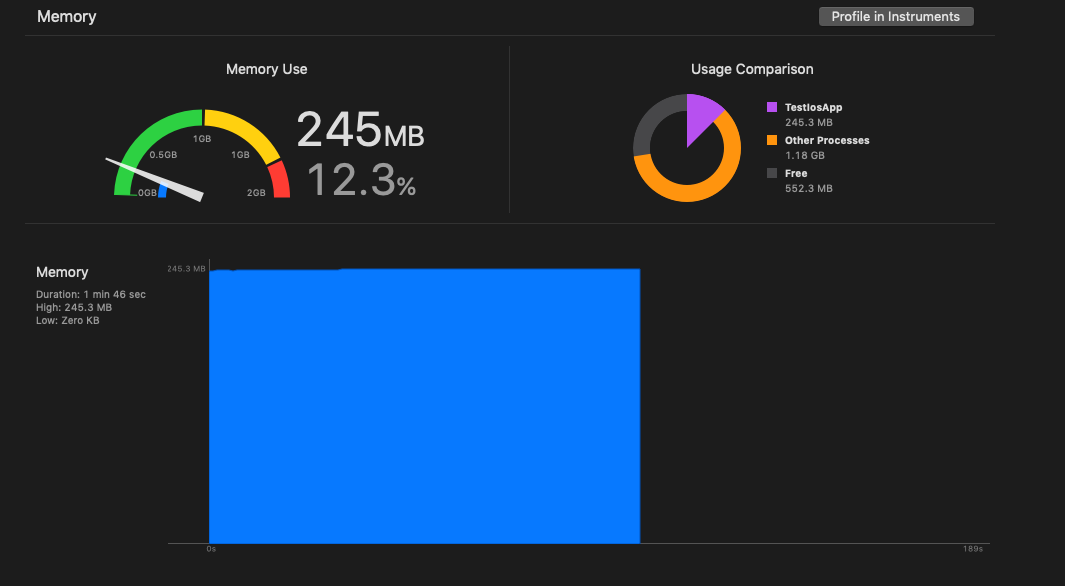
Running this on a clean iOS app produces the following memory graphs (which closely matches the RSS behavior on linux):
before the patch:
with the patch:
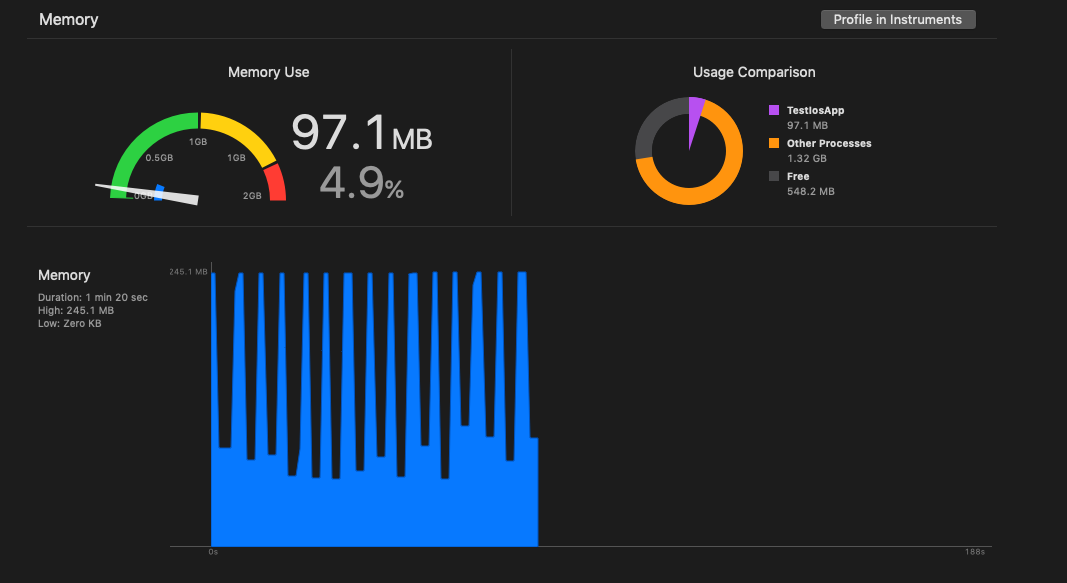
FYI, instead of using
ps -o rss=to check resident memory, we now usevmmap ${PID} | grep "Physical footprint:"which correctly reflects RSS usage on macOS.DanielZlotin commentedon Jan 27, 2019
I guess we can close this once the patch lands