Description
What version of Go are you using (go version)?
$ go version
go version go1.16.8 darwin/amd64
Does this issue reproduce with the latest release?
Maybe, I am not sure, GC Pacer Redesign maybe reduce the probability of it
What operating system and processor architecture are you using (go env)?
darwin/amd64
What did you do?
A test similar to https://go-review.googlesource.com/c/go/+/227767/3
package main_test

import (
	"runtime"
	"testing"
)

var setGCPercentBallast interface{}
var setGCPercentSink interface{}

func TestMemStats(t *testing.T) {
	defer func() {
		setGCPercentBallast = nil
		setGCPercentSink = nil
		runtime.GC()
	}()

	runtime.GC()
	var m1 runtime.MemStats
	runtime.ReadMemStats(&m1)

	// Create 50 MB of live heap as a baseline.
	const baseline = 50 << 20
	setGCPercentBallast = make([]byte, baseline-m1.Alloc)
	// Allocate a bunch and check that we stay under the limit.
	runtime.ReadMemStats(&m1)
	var m2 runtime.MemStats
	for i := 0; i < 2000; i++ {
		setGCPercentSink = make([]byte, 1<<20)
		runtime.ReadMemStats(&m2)
	}
	if m1.NumGC == m2.NumGC {
	}
}
go test -c .
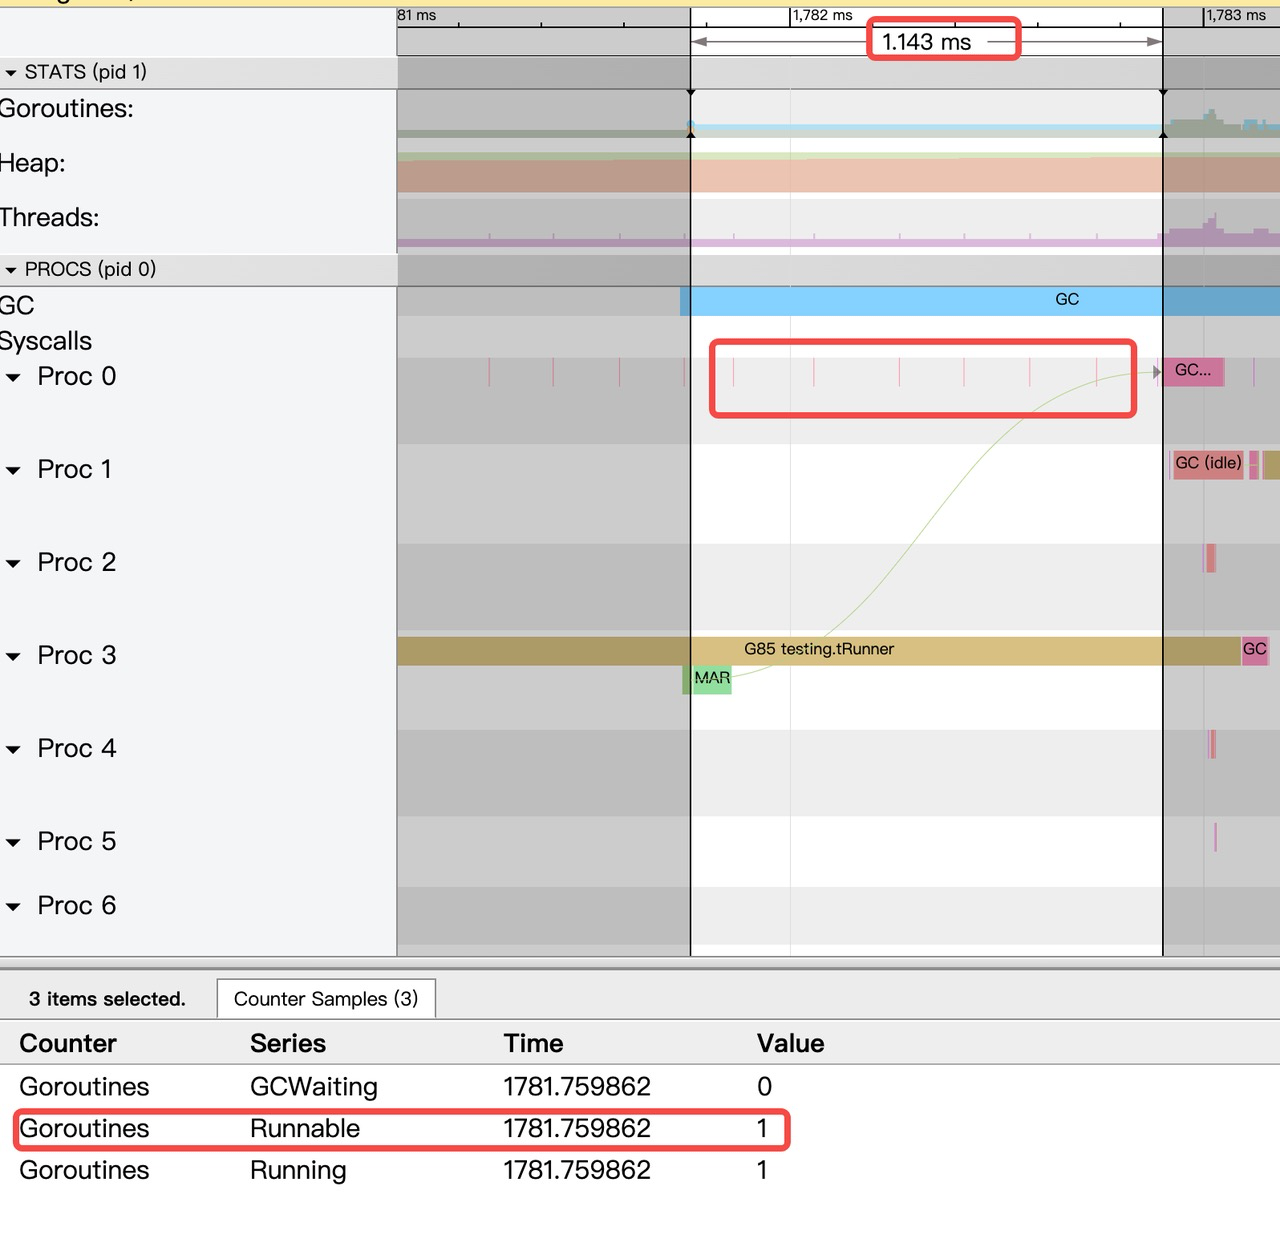
GODEBUG=gctrace=1 ./demo.test -test.v -test.trace=./16_trace_1 -test.run=^TestMemStats$What did you expect to see?
heap_live <= next_gc
What did you see instead?
probabilistic recurrence
gc 4 @0.028s 1%: 0.015+0.87+0.042 ms clock, 0.18+0.095/0.18/0.19+0.50 ms cpu, 102->103->53 MB, 104 MB goal, 12 P
gc 5 @0.037s 1%: 0.015+0.50+0.018 ms clock, 0.19+0.12/0.26/0.089+0.21 ms cpu, 104->108->56 MB, 106 MB goal, 12 P
gc 6 @0.043s 1%: 0.021+0.40+0.025 ms clock, 0.25+0.055/0.20/0.17+0.30 ms cpu, 109->110->53 MB, 112 MB goal, 12 P
and
gc 23 @0.217s 1%: 0.19+0.80+0.033 ms clock, 2.3+0.076/0.25/0.13+0.39 ms cpu, 106->107->53 MB, 108 MB goal, 12 P
gc 24 @0.242s 1%: 0.063+4.0+0.051 ms clock, 0.76+0.081/0.33/0.001+0.61 ms cpu, 104->111->59 MB, 106 MB goal, 12 P
gc 25 @0.256s 1%: 0.046+1.1+0.008 ms clock, 0.55+0.13/0.13/0.24+0.10 ms cpu, 113->114->53 MB, 118 MB goal, 12 P
While this example is extreme, does this result meet expectations?
There is only one user Goroutine running in the demo,
In this scenario, should the GC pacer mechanism ensure that heap_live <= next_gc ?
some brief analysis:
I guess it is related to this commit https://go-review.googlesource.com/c/go/+/216557 ,
Frequent ReadMemStats/STW causes GC mark goroutine to execute too slowly.
I also found some interesting phenomena in the positioning of this problem (maybe it is normal, but maybe some strategy adjustments can be made if necessary)
- M is awakened but cannot execute bgscavenge in Runnable. Maybe it is caused by directly entering the following code in findrunnable?
	if sched.gcwaiting != 0 {
		gcstopm()
		goto top
	}
- In this domo scenario, since there is only one user goroutine, after M is woken up, the findRunnableGCWorker will not execute in the findrunnable, and the gcMarkWorker of DedicatedMode starts too slowly.
Metadata
Metadata
Assignees
Labels
Type
Projects
Status
Activity
prattmic commentedon Jan 13, 2022
cc @mknyszek
mknyszek commentedon Jan 13, 2022
It's always true that the GC can overshoot by a little bit;
next_gcis a target or a goal, not a hard-and-fast rule. With that being said, it's unfortunately true that there are a few rare ways overshoot can get unbounded. One of them is goroutines unexpectedly grabbing a ton of assist credit, so they don't help even if the GC really needs it. There are a few ways this can happen, and they're pretty subtle. See #42430 and #37331.(There is a "hard goal" that is 10% above the heap goal in Go 1.17 or earlier, and proportional to the discovered live heap in Go 1.18 and later, but even this can be broken in this way.)
In this particular case, I suspect the frequent STW calls mean that dedicated and idle workers get interrupted in a way that ends up creating a greater opportunity for goroutines with assist credit to allocate beyond the goal, but it's hard to say. IMO the
gctraceoutput you're showing looks reasonable to me. Using theruntime/metricspackage (introduced in Go 1.16) instead ofReadMemStatswill likely give you better behavior, because it does not STW.I'm just taking a guess on this so feel free to ignore me, but if your goal is to build a memory limit mechanism on top of
GOGC, that's going to be hard without being conservative about how much headroom you give yourself. See #48409 which should help on that front.[-]runtime: Frequent ReadMemStats will cause heap_live to exceed next_gc [/-][+]runtime: frequent ReadMemStats will cause heap_live to exceed next_gc [/+]WangLeonard commentedon Jan 13, 2022
@mknyszek
Thank you for your detailed answer!
got it, and I will try to modify the test case with runtime/metrics.
Aha, you are right.
I'm using SetMaxheap in my go1.14 program, and it works very well. When I try to port it to go1.16, the test cases would randomly fail. After I try to locate, created this issue.
I just think that the pacer should guarantee heap_live <= next_gc when there is only one goroutine, of course it's not a question of correctness, and I understand it now, thanks.
I have read and continue to follow #48409, It's more complete and fixes some of the problems with Setmaxheap, very nice!
but it depends on "GC Pacer Redesign" which on go1.18+, so my program still needs to use SetMaxheap in go1.16.
By the way, does it have cl now? I'd like to use and verify it. Looking forward to it being released soon.
Thank you!