x/website: visualization tools in gc-guide have left text cut off with firefox #53850
Description
What is the URL of the page with the issue?
https://tip.golang.org/doc/gc-guide
What is your user agent?
Mozilla/5.0 (X11; Linux x86_64; rv:91.0) Gecko/20100101 Firefox/91.0
Screenshot
What did you do?
Visited and started reading the gc-guide.
What did you expect to see?
The full interactive graphs.
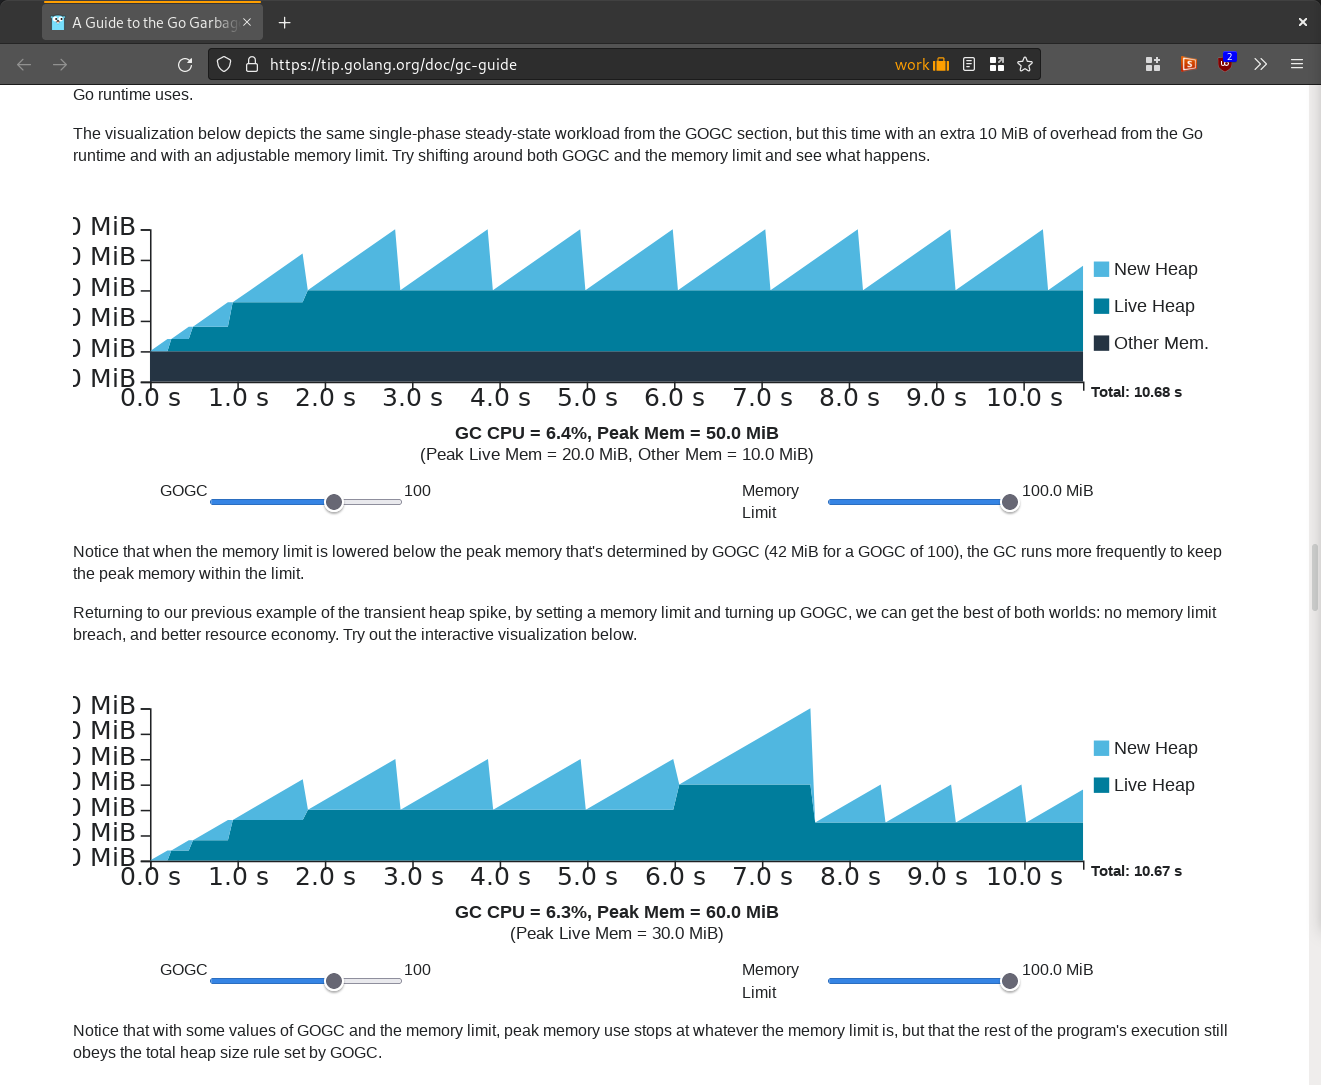
What did you see instead?
The interactive visualization tools didn't fully show the Y axis labels. They were cut off on the left. The screenshot says it best.