Improve closing behavior for cache/informer. #505
Conversation
|
[APPROVALNOTIFIER] This PR is APPROVED This pull-request has been approved by: brendandburns The full list of commands accepted by this bot can be found here. The pull request process is described here
Needs approval from an approver in each of these files:
Approvers can indicate their approval by writing |
|
I have tested your changes and I'm still seeing a connection leak: |
| @@ -1,18 +1,24 @@ | |||
| import byline = require('byline'); | |||
| import request = require('request'); | |||
| import { Duplex } from 'stream'; | |||
There was a problem hiding this comment.
Needed to move stream-buffers from devDependencies to dependencies in package.json for this to work.
|
@kscharm ok, I will try to reproduce. Approx. how many endpoints/sec are you creating/deleting in your testing? Thanks! |
|
Also, how quickly does it reproduce? Your test shows about 1hr of waiting, but does it start to leak connections sooner? |
75b67e5 to
9fbe61a
Compare
|
I tried to reproduce this locally and I couldn't. Do you have a clean repro I can try in my home cluster? More details about how you are accessing the API server? I think that the problem is in cleaning up the connection opened for the I updated the PR with an additional option to disable request pooling. Can you retest this new patch? Apologies for making you test my patches, but it's hard without a local repro. |
I'm not 100% sure on the exact number, but it's very few endpoints during the course of testing.
It starts to leak much sooner, as the number of connections appears to double every 10 minutes.
I'm using the same example code that my teammate posted in the original issue: function startEndpointWatcher (labelSelector = '', namespace = POD_NAMESPACE) {
const informer = k8s.makeInformer(kc, `/api/v1/namespaces/${namespace}/endpoints?labelSelector=${labelSelector}`,
() => k8sApi.listNamespacedEndpoints(namespace, undefined, undefined, undefined, undefined, labelSelector))
_.forEach(['add', 'update', 'delete'], event => informer.on(event, updateEndpointsFn))
informer.on('error', err => {
console.log('Watcher ERROR event: \n', err, '\nRestarting Watcher after 5 sec...')
setTimeout(informer.start, 5000)
})
informer.start()
.then(() => console.log('HostIPs-Endpoint-watcher successfully started'))
.catch(err => console.log('HostIPs-Endpoint-watcher failed to start: \n', err))
}
async function updateEndpointsFn (endpointsObj) {
console.log('updateEndpointFn: ' + endpointsObj.metadata.name)
}
startEndpointWatcher(CASSANDRA_ENDPOINT_LABELS)The informer watches for any changes to the Cassandra pods. The majority of the events occur during bootstrapping when the cluster is first coming up. I will test your new changes and report back to you. |
|
Still not working after disabling request pooling changes: |
|
Are you seeing the errors:
|
|
Nope, just the start log and then output from updateEndpointsFn |
|
Do you have the apiserver logs? It would be interesting to see what the requests are that the server is receiving (and at what interval) I'll try to repro using your snippet as well. |
|
Working on getting the apiserver logs. Here are sample logs from the informer: Notice that a burst of updates happen exactly 10 minutes apart and that the number of updates appears to double each time. |
|
This set of logs corresponds with this: |
|
Here are the logs from a 1.5 hour run. There are a lot more of endpoint requests than I originally thought... |
|
Some interesting things in those logs: There are watches from 4 different IP addresses (are you running multiple pods that are watching?) There's a whole burst of watches from the same IP address at the same time. Is it possible that you are instantiating multiple informers somehow? I'm worried about your restarting of the informer from within the informer's There's definitely something weird going on, but from looking at the logs it appears that the problem is that many watches are being created, not that watch connections aren't getting closed properly. I'll try to find time to run your repro code in my test cluster. |
|
Aha! I think I figured it out. Stay tuned. |
9fbe61a to
301951d
Compare
|
Ok, sorry to keep making you do this, but can you try the patch again, I think I found the issue, the done handler (which restarts the watch) is getting called twice every time there's an error. If this doesn't fix it I'm back to zero :( |
|
Ugh, still experiencing the same behavior. I've added in additional logs to be sure Here are the net stat logs: |
|
Also notice that all the port numbers change every time there is a burst of new connections. |
|
If you only have one pod, it's really weird that there are four different ip addresses in your API server logs. I think at this point I really need to get a local repro to make progress, so I will focus on that. |
|
(and I'm afraid it may take a while given other obligations) |
|
@brendandburns: PR needs rebase. Instructions for interacting with me using PR comments are available here. If you have questions or suggestions related to my behavior, please file an issue against the kubernetes/test-infra repository. |
| // TODO: I don't love this, because both 'error' and 'close' call the done handler with the same error | ||
| // We should probably only do one or the other, but there's challenges because of async delivery and it's | ||
| // important to know if the close event is occurring because of an error. So for now, this needs to be | ||
| // handled in the client. |
There was a problem hiding this comment.
Instead of leaving the code in watcher as it is and having workarounds for all potential users of the watcher that are IMHO unreliable anyway, I think it would have been better to fix it here. Would a boolean variable indicating that the done callback was called be sufficient? That way we could guarantee that the done callback is called at most once, that is exactly what users of the watcher expect.
| // watch.ts | ||
| if (!this.stopped) { | ||
| this.stopped = true; | ||
| this.callbackCache[ERROR].forEach((elt: ObjectCallback<T>) => elt(err)); |
There was a problem hiding this comment.
I don't see that we would set this.stopped to false again in the start() method. If I understand correctly it prevents the cache from being reused. And if we set stopped to false in start() method then it would create a race condition when doneHandler is called twice and stopped is set to false between those two calls. To me, that does not look like a good way to go. Fixing the watcher to call doneCallback just once sounds like a better option.
|
Your fix in other PR solves the problem with setting stopped that I mentioned here, though I think it could have been better. Adding another callback for error complicates the usage of watcher, while the only thing that we really need is to call done callback just once. That can be fixed in watcher without changing any of the code using the watcher. So 1. simple and 2. compatible: https://github.com/jkryl/javascript/commit/40cb59c79223cfba30d8ab2b254d4aae148c3134 I took this PR and improved it further. The fix for connection leak is also part of those changes. It works for me and our product so far, though I would like to give it some more time to prove its stability and test it on other clouds than just AWS and Azure. |
|
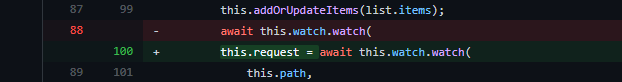
@jkryl Your referenced fork (jkryl@40cb59c) has what I suspected was the cause of the memory leak (#494) but didn't get to test it. It is one specific line in It created a new watch referenced by no variable (hence my suspicion it was the source of the memory leak), instead of updating the cache's instance. If you haven't already, creating a PR of your fork would be a great contribution! |
|
@jc-roman : yes. That line but also the line where abort is called for the request ("destroy" does not really destroy the connection). I might have some time to prepare a PR before the end of this year. Basically, the fix is good as it is, but I just need to modify test cases. |
Fixes #494