ENH/VIS: Dataframe bar plot can now accept width and pos keywords #6644
Conversation
|
Thanks. We'll need an entry under the API section in |
|
@TomAugspurger iirc some convention for simply passing thru keywords on plot directly to matplotlob |
|
Thank you for your confirmation. I've added release note description. I'll recheck once #5638 is merged to master. |
|
@jreback We do some stuff on the pandas side before passing things through to matplotlib's ax.bar(). Right now if you pass a @sinhrks What do you think about |
|
OK, agreed. I've changed the keyword to Also, I found some bar plot related dataframe tests are under |
|
Travis test should have passed, but no icon seems to be displayed. Is it OK or any other configuration required? |
| @@ -131,6 +131,10 @@ API Changes | |||
| ``FutureWarning`` is raised to alert that the old ``rows`` and ``cols`` arguments | |||
| will not be supported in a future release (:issue:`5505`) | |||
|
|
|||
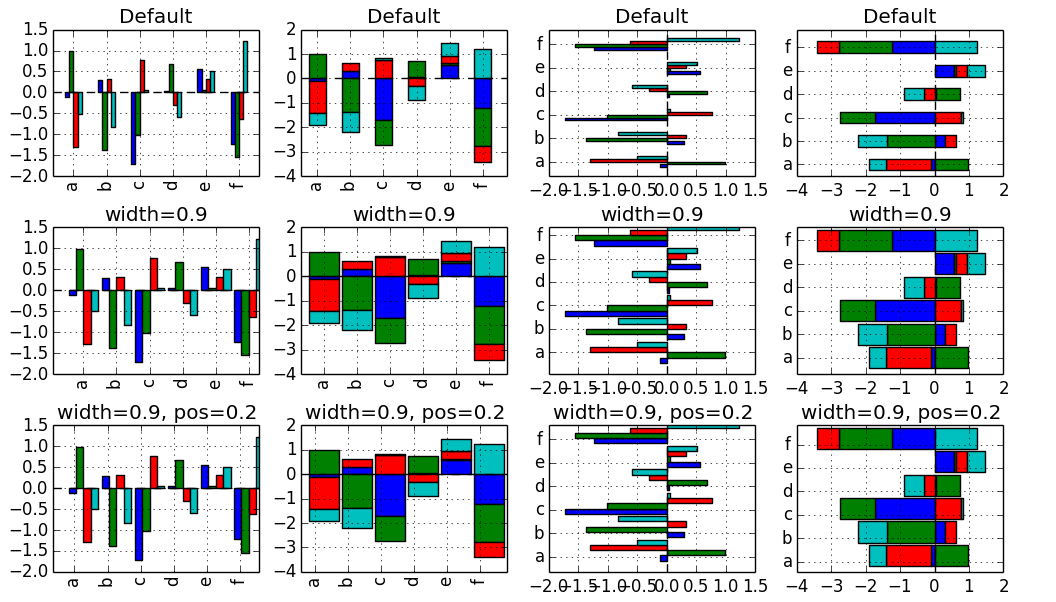
| - Following keywords are now acceptable for :meth:`DataFrame.plot(kind='bar')` and :meth:`DataFrame.plot(kind='barh')`. | |||
There was a problem hiding this comment.
pls add to v0.14.0.txt as well
|
Thanks. Got it. |
|
pls rebase and then squash as well |
|
Yes, did it. |
|
Thanks, I added your note about the position argument to the |
|
@TomAugspurger did you mean to close? |
|
Hmm. I merged via command line since I had to move the release note down a line. Did I break something? |
|
It is merged. 8d87a29 |
|
@TomAugspurger I see..no problem...git closes the issue automatically, but I see you just put a reference (which is correct!) @sinhrks thanks! |
|
Thanks |
|
@jreback I see that this failed on Travis: https://travis-ci.org/pydata/pandas/jobs/21098475 Looking into it. |
|
Hmm strange. Here's the failing test: I can't reliably reproduce the failure. What does reproduce it is if I don't do the Do you think it could have randomly drawn 10 values all greater than .5? The probability is I'm going to set a seed and see if it fixes. |
|
See #6670 for a hopeful fix on the last comment. |
Following keywords are now acceptable for
dataframe.plot(kind='bar')anddataframe.plot(kind='barh').width: Specify the bar width. In previous versions, static value 0.5 was passed to matplotlib and it cannot be overwritten.pos: Specify relative alignments for bar plot layout. From 0 (left/bottom-end) to 1(right/top-end). Default is 0.5 (center).Examples: