You signed in with another tab or window. Reload to refresh your session.You signed out in another tab or window. Reload to refresh your session.You switched accounts on another tab or window. Reload to refresh your session.Dismiss alert
I believe this is a bug, possibly a regression in recent browser versions? But perhaps it has never worked and this is a feature request?
Details about the bug:
There are a number of issues with the the way the p5.js Web Editor loads the sketch javascript that makes it not work well with Chrome/Chromium developer tools:
It is difficult if not impossible to find the running sketch javascript via the Sources tab of the dev tools.
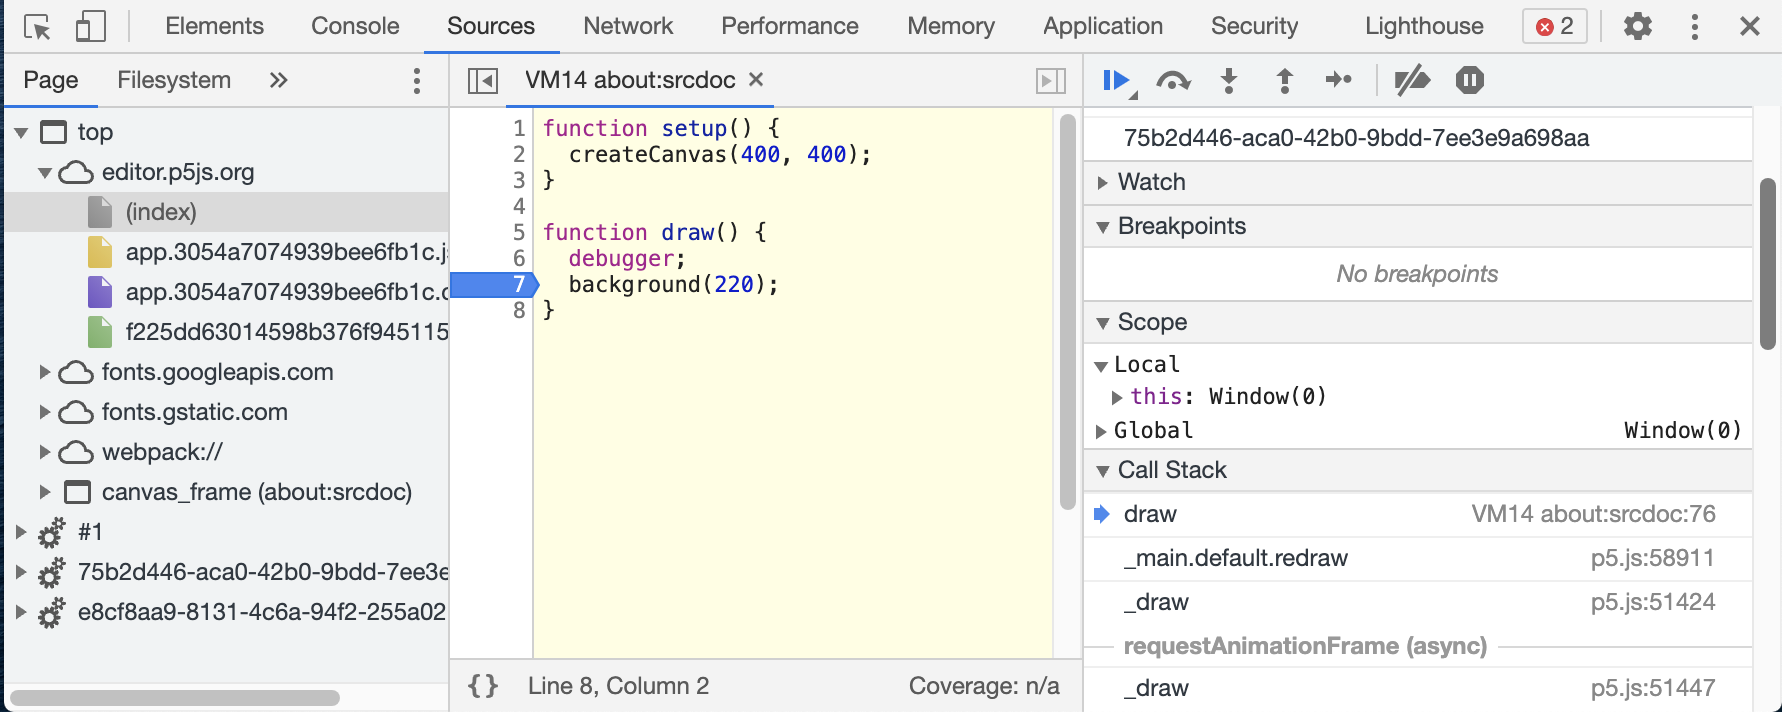
The source opened when a debugger; statement is executed doesn't show the execution pointer on the correct line.
Stack traces and the call stack in the debugger show incorrect line numbers.
Here's what the broken dev tools look like using the p5.js editor:
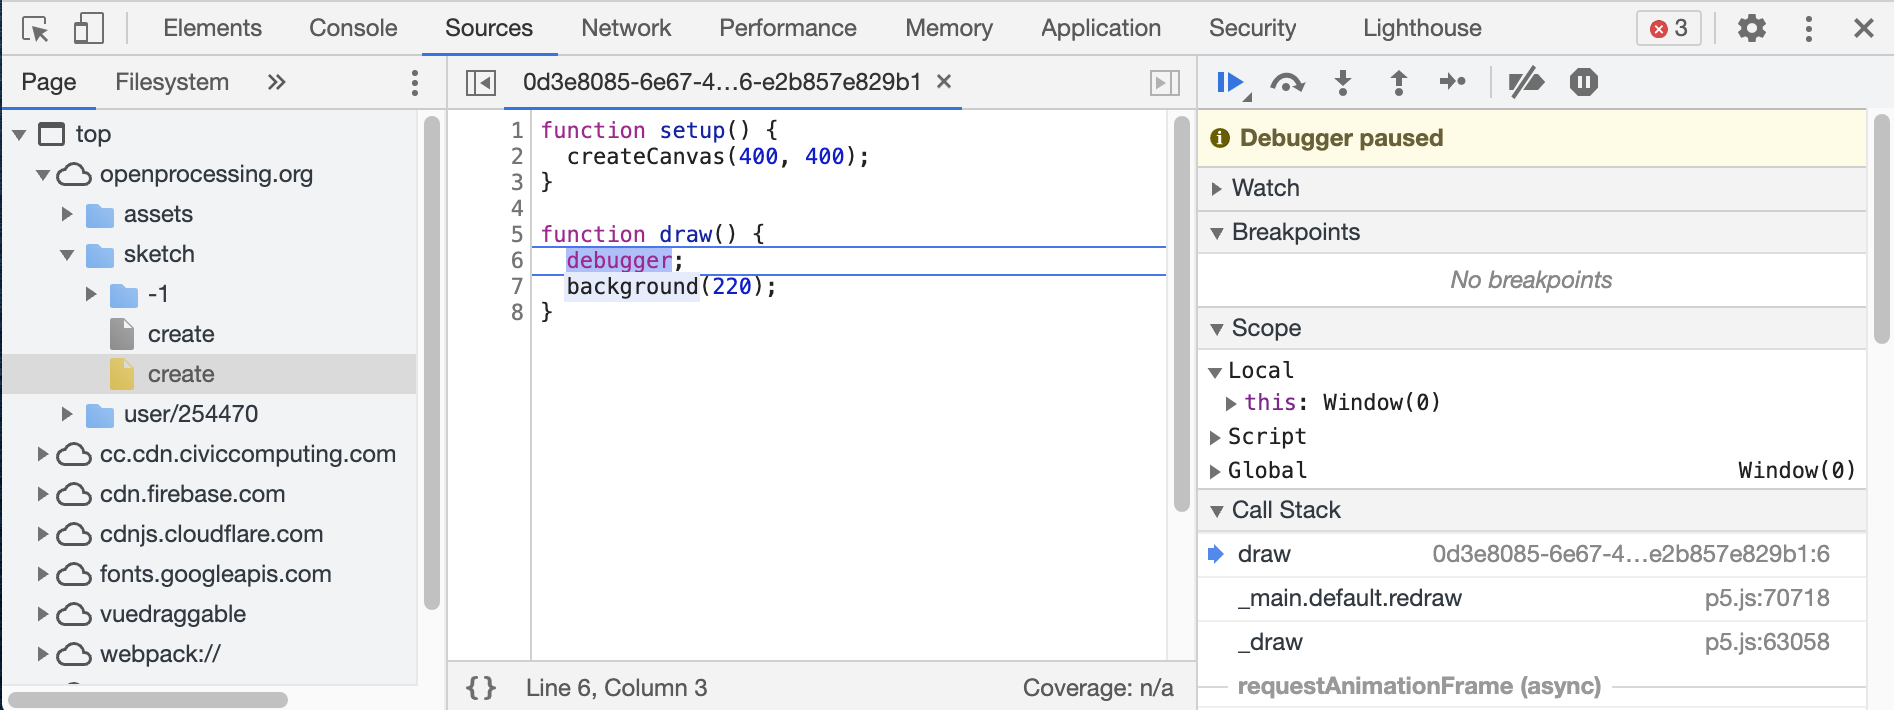
And here's what they should look like (using the OpenProcessing.org editor for comparison):
Web browser and version: Google Chrome 90.0.4430.93 (also reproducible on other Chromium based browsers such as Brave)
Operating System: MacOS
Steps to reproduce this bug:
The text was updated successfully, but these errors were encountered:
Welcome! 👋 Thanks for opening your first issue here! And to ensure the community is able to respond to your issue, be sure to follow the issue template if you haven't already.
Thanks for reporting! This is due to a difference in how the p5.js Editor and OpenProcessing handle rendering sketches. I've been working on rewrite of how the p5.js Editor renders, and this issue has given me a lot to think about...
I was actually able to figure out a fix for this! It will take a minute to get tested and merged in and deployed, as it's dependent on some rendering changes I'm making as part of #166.
Nature of issue?
I believe this is a bug, possibly a regression in recent browser versions? But perhaps it has never worked and this is a feature request?
Details about the bug:
There are a number of issues with the the way the p5.js Web Editor loads the sketch javascript that makes it not work well with Chrome/Chromium developer tools:
debugger;
statement is executed doesn't show the execution pointer on the correct line.Here's what the broken dev tools look like using the p5.js editor:
And here's what they should look like (using the OpenProcessing.org editor for comparison):
The text was updated successfully, but these errors were encountered: