Response time increases due to WebMvcMetricsFilter.doFilter() #14929
Description
Here is a New Relic screenshot of response time for one of my endpoints:
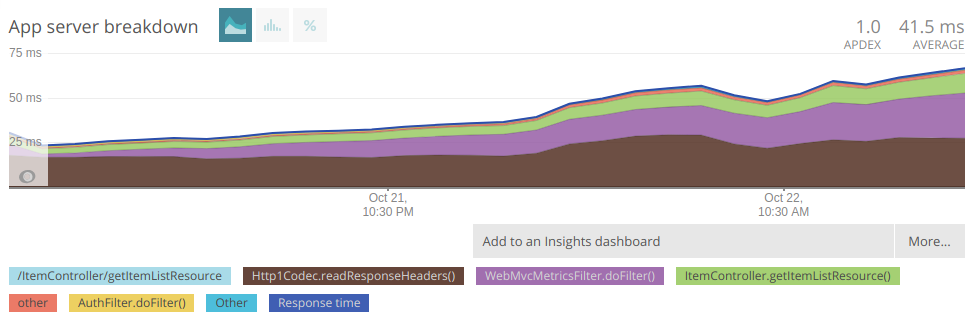
The issue is with the WebMvcMetricsFilter.doFilter() component. It starts out as almost zero when app is deployed and then gradually increases. In my app, it has gone upto ~200ms.
Is it because I have enabled actuator in my application?
It is present in the response time chart for all my endpoints and has roughly the same value (irrespective of the throughput or actual response time of the endpoint).
I'm using Spring boot 2.0.1.RELEASE.