Scaled densities/counts in 2d density/bins plots (#2679) #2680
Conversation
|
This seems like a good idea to me. Unfortunately it's too late for 2.3.0, we're in a soft freeze. A couple of comments:
|
R/stat-density-2d.r
Outdated
| @@ -60,12 +60,13 @@ StatDensity2d <- ggproto("StatDensity2d", Stat, | |||
| lims = c(scales$x$dimension(), scales$y$dimension()) | |||
| ) | |||
| df <- data.frame(expand.grid(x = dens$x, y = dens$y), z = as.vector(dens$z)) | |||
| df$nz <- df$z/max(df$z) | |||
There was a problem hiding this comment.
Why nz? This naming seems strange.
There was a problem hiding this comment.
I wasn't sure what to call this one. I went with nz for "normalized z" as in ndensity and ncount. In my own code, I normally name variables which are derived from other variables using "x.difference" so z would become, z.scaled or similar, but I wasn't sure what the convention was for ggplot2.
Alternatively, we could just call it scaled, but then the renaming that happens a few lines down would be somewhat redundant.
There was a problem hiding this comment.
I find it strange to introduce a variable name and then change it 5 lines down. Also, what happens if the if (contour) { branch is executed? What does StatContour do to the nz column?
There was a problem hiding this comment.
I'm inclined to agree; however, I tried to preserve as much of the approach of the original stat_density function as I could and that was the approach taken there:
#exerpt from stat_denisty, line 62
    df <- data.frame(expand.grid(x = dens$x, y = dens$y), z = as.vector(dens$z))
    df$group <- data$group[1]

    if (contour) {
      StatContour$compute_panel(df, scales, bins, binwidth)
    } else {
      names(df) <- c("x", "y", "density", "group")
      df$level <- 1
      df$piece <- 1
      df
    }
StatContour doesn't do anything with the nz column, so to avoid having to rename things we could just name it when we create it.
    df <- data.frame(expand.grid(x = dens$x, y = dens$y), z = as.vector(dens$z))
    df$scaled <- df$z / max(df$z) ## <- here
    df$group <- data$group[1]

    if (contour) {
      StatContour$compute_panel(df, scales, bins, binwidth)
    } else {
      names(df) <- c("x", "y", "density", "scaled", "group")
      df$level <- 1
      df$piece <- 1
      df
    }
Or we could just create it later on, which avoids passing a column that won't be used to StatContour
    df <- data.frame(expand.grid(x = dens$x, y = dens$y), z = as.vector(dens$z))
    df$group <- data$group[1]

    if (contour) {
      StatContour$compute_panel(df, scales, bins, binwidth)
    } else {
      names(df) <- c("x", "y", "density", "scaled", "group")
      df$scaled <- df$density / max(df$density) ## <- here
      df$level <- 1
      df$piece <- 1
      df
    }
Or perhaps there's a third even cleaner method to achieve the same goal. Which approach do you think would be best?
There was a problem hiding this comment.
I think the later creation is better, though you shouldn't name it before you add it to the data frame. :-)
There was a problem hiding this comment.
Fixed! ✨
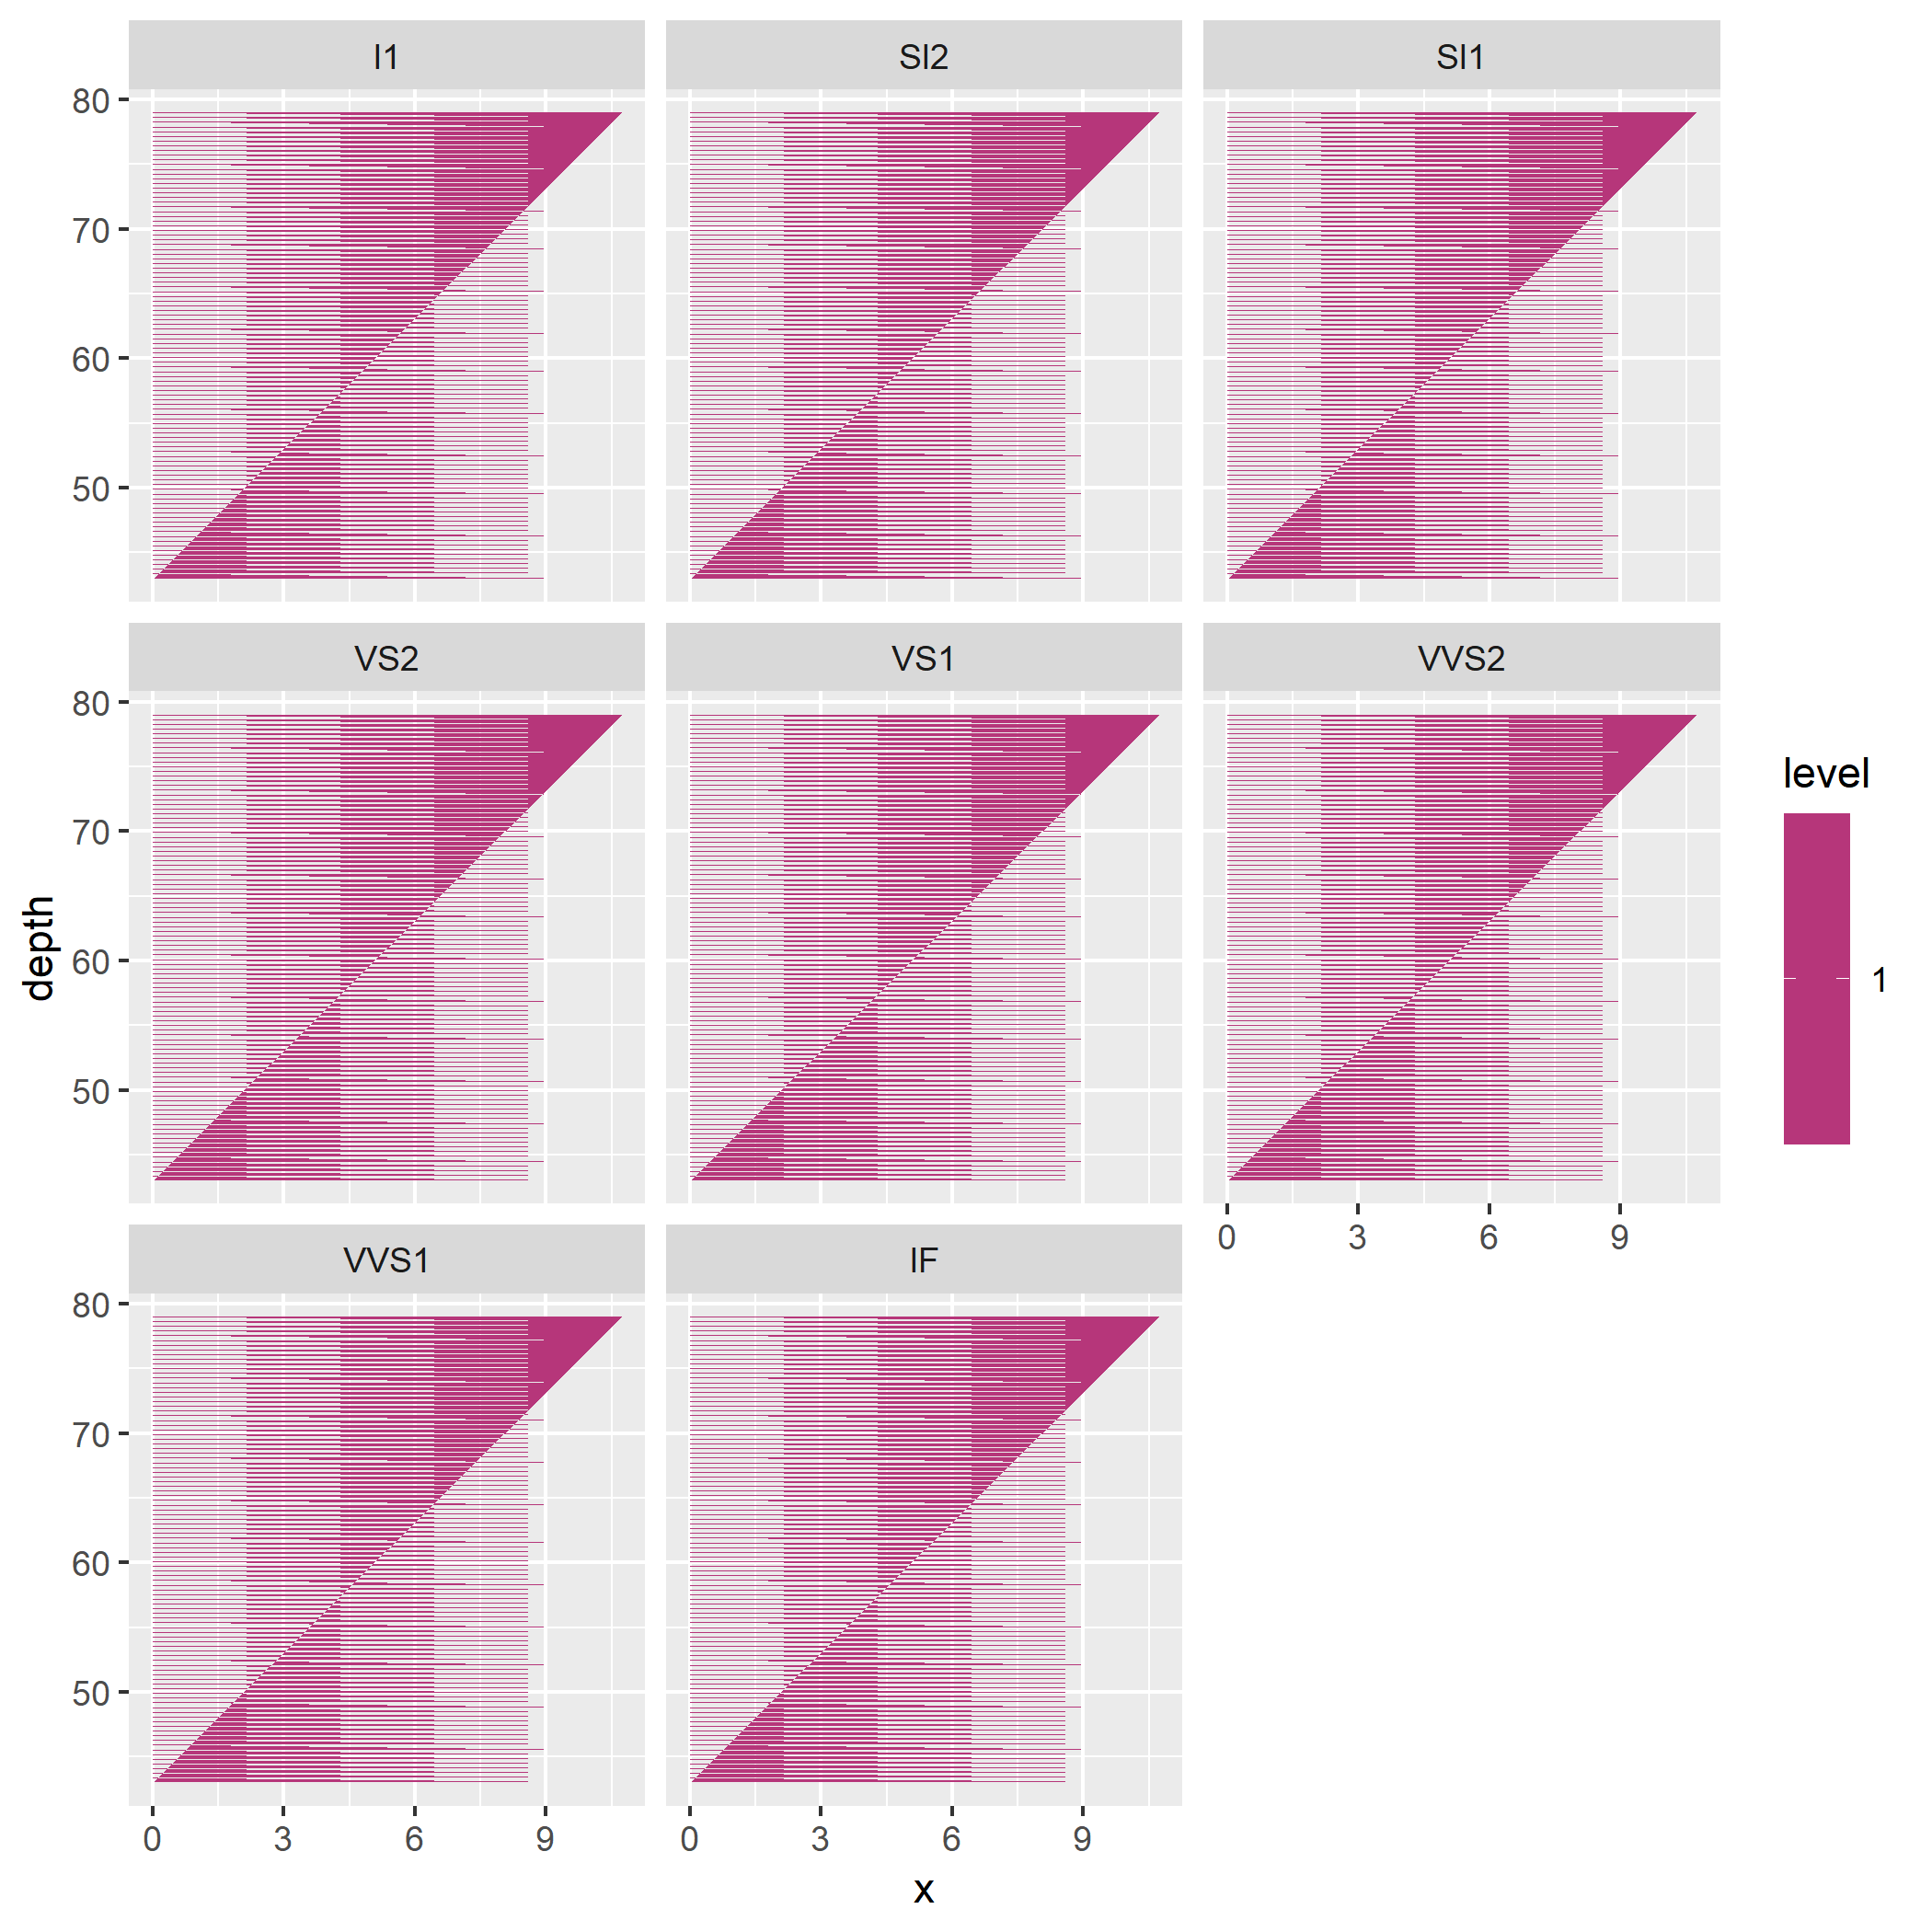
This may be a separate branch/pull request, but it might be worthwhile to change the behavior of stat_density2d when aes(fill = stat(level)) is called when contour = FALSE and the behavior of aes(fill = stat(density)) when contour = TRUE to return an error or a warning. Neither of those statistics are meaningful when called in the wrong context and it can return some cryptic errors as seen below. 😬
library(ggplot2)
library(dplyr)
library(viridis)
#2d densiy plot colored by level
diamonds %>%
ggplot(aes(x=x, y= depth)) +
  stat_density_2d(aes(fill = stat(density)),
                  geom = "raster",
                  n = 100,
                  bins = 10,
    contour = T) +
  facet_wrap(clarity~.) +
  scale_fill_viridis(option = "A")

#>  Error in is.finite(x) : default method not implemented for type 'closure'
diamonds %>%
ggplot(aes(x=x, y= depth)) +
  stat_density_2d(aes(fill = stat(level)),
                  geom = "polygon",
                  n = 100,
                  bins = 10,
    contour = F) +
  facet_wrap(clarity~.) +
  scale_fill_viridis(option = "A")
|
Thanks for the tips! I've updated the styling and documentation as suggested. I wasn't sure how to best describe the |
|
@clauswilke can you please finish this off by approving the PR (if you think it's ready to be merged) |
|
@hadley Yes. One thing that I think needs to be fixed in the ggplot2 codebase first is a new section in NEWS.md for post 3.0.0 development. @bjreisman At a minimum, I think roxygen needs to be rerun so all the documentation changes are processed correctly. I would also suggest adding a line to |
|
Oops yes, done. |
R/stat-density-2d.r
Outdated
| @@ -66,6 +71,7 @@ StatDensity2d <- ggproto("StatDensity2d", Stat, | |||
| StatContour$compute_panel(df, scales, bins, binwidth) | |||
| } else { | |||
| names(df) <- c("x", "y", "density", "group") | |||
| df$scaled <- df$density / max(df$density) | |||
There was a problem hiding this comment.
Is there a reason this is called scaled and not ndensity as in the other stats? Also, does the max function need an argument na.rm = TRUE?
There was a problem hiding this comment.
Thanks for taking the time to consider this addition!
I wasn't entirely happy with the switch between ndensity to scaled either and would actually prefer to use ndensity here. However, in stat_density [the 1d version], the rescaled statistic is called scaled while in stat_bin it's called ndensity or ncount.
Since stat_density_2d is the 2d version of stat_density I tried to mirror the syntax by naming it scaled. I think it might make the most sense to use one syntax throughout all the stat functions (ndensity), but I will leave that to your discretion. To summarize, I think there are a three options.
-
Mirror the syntax from the 1d versions of the stat layers such that
stat_density_2dandstat_densityusescaledwhilestat_bin2d,stat_hexbin, andstat_binusendensityandncount. (implemented this PR) -
(2a) Switch over to a single syntax for the 2d stats with this version -
ndensityreplacesscaledinstat_density_2d. -
(2b) Switch over to a single syntax for all density based stats -
ndensityreplacesscaledin bothstat_densityandstat_denisty_2d. I suppose you would want to just duplicatescaledand name the new variablendensityto avoid breaking existing code.
--
RE: na.rm = TRUE; you're correct, I've added that to my local version for my next PR. I can submit that change once scaled vs. ndensity is settled and I'll update the documentation and news as well.
There was a problem hiding this comment.
I think option 2b (uniform naming with duplicated scaled column for stat_density) is best. But I'd like to hear @hadley's input as well.
There was a problem hiding this comment.
Yeah, 2b sounds good (assume it doesn't affect existing code, in which case scaled should be added, instead of replacing the existing variable name)
|
Okedoke, I've implemented option 2b with the latest commit, as updating NEWS.md and adding an example to I tried running roxygen to update the documentation, but for some reason it didn't recognize the |
NEWS.md
Outdated
|
|
||
| * `stat_density()` now includes the calculated statistic `nlevel`, an alias | ||
| for `scaled`, to better match the syntax of `stat_bin` (@bjreisman, #2680) | ||
|
|
There was a problem hiding this comment.
Unfortunately this whole part seems to have ended in the wrong section of the file. It should be at the very top, under ggplot2 3.0.0.9000. You may have to rebase. Also, the whole section should only be 1-2 sentences, such as "stat_contour(), stat_density2d(), stat_bin2d(), stat_binhex() all now also calculate normalized densities, levels, and counts (@bjreisman, #2680)".
There was a problem hiding this comment.
Apologies, one more comment: The issue this is closing is #2679, not #2680. #2680 is the pull request. And one of the git commit messages should contain the phrase "Closes #2679" or "Fixes #2679" so that github automatically closes the issue once the pull request is integrated. You can add this to the next commit you make.
R/stat-density.r
Outdated
| @@ -21,6 +21,8 @@ | |||
| #' \item{count}{density * number of points - useful for stacked density | |||
| #' plots} | |||
| #' \item{scaled}{density estimate, scaled to maximum of 1} | |||
| #' \item{ndensity}{alias for stat(scaled), to mirror the syntax of | |||
| #' geom_bin} | |||
There was a problem hiding this comment.
Can you put stat(scaled) and geom_bin in backticks so they show up as code? And also please write geom_bin() (with parentheses).
|
I suspect I can fix the roxygen issue if you give me access to your repo fork. Won't get to it until later in the week though. |
|
Done! Thanks for taking the time to review these changes. |
…stograms (bin2d and binhex).
+ updated documentation
(revisions suggested by clauswilke)

Notes:
Wasn't sure how to best describe the 'pieces' computed variable generated by stat_contour;

'nz' variable remains for now in stat_density_2d, open to suggestions for a better name.
…to minimize renaming of existing variables. 🎨
- swapped `scaled` for `ndensity` in `stat_density2d()`;

- added `ndensity` to `stat_density` as an alias for `scaled`;

- added an example to `geom_densityd2()`;

- updated NEWS.md to reflect these changes.
|
@bjreisman I have rebased your PR and made some documentation cleanups. Let's see if all the checks pass. Most importantly, you were using |
|
I just merged this, thanks! |
|
This old issue has been automatically locked. If you believe you have found a related problem, please file a new issue (with reprex) and link to this issue. https://reprex.tidyverse.org/ |
I added 'scaled' statistics to the
stat_bin2d,stat_binhex,stat_density_2d, andstat_contourfunctions for plotting 2d distributions normalized to a common height. This would be very useful for faceted 2d plots, where the maximum density/count can vary greatly between panels.(This is my attempt to add the feature I had requested in issue #2679.)
I tried my best to mirror the corresponding statistics from the 1d functions:
countcountcountcountcountncountncountncountdensitydensitydensitydensitydensityndensityndensityndensityIt was a little bit harder to get things to match-up one-to-one for the density based function, so some adjustment to the syntax may be needed.
countdensitydensitydensityscaledscaledpiecespieceslevellevelnlevelHere is an example of the revised functions in action: